Mouse Brain data: Results
The results are divided into sections:
General notes applying to all analysis:
- Results images are filtered to remove genes with mostly negative expression values.
- Images show data that has been adjusted to mean zero, variance one, and clipped to increase contrast. More on reading images below.
- The image column headings refer to "subA"; this is an artifact of how we set this up, and both subA and subB arrays were used for the analysis.
- Clicking on an image will show you the detailed results for that gene.
- There are also HTML versions of the data. At this point the genes which have mostly negative values are still in those tables. A warning will be shown when you encounter one which would be filtered.
- You can access Sandberg's raw data file lines corresponding to a probe or accession number by entering it in the form; similarly you can get this from the HTML table versions of the data.
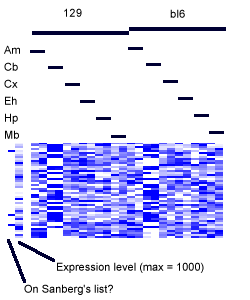
- In each figure, genes with p values <0.001 are shown. The leftmost column shows a black tick if Sandberg listed the gene; the second column is the average expression level of the gene (clipped at 1000). The rest of the columns show the data, adjusted to a mean of zero and variance of one, and clipped to the range -1 to 1 (this increases the contrast). The genes are listed in order of increasing p value.
- Annotations are not necessarily complete as given here.
All the results sections have visualizations of the data. In all cases, the data is organized by exerimental condition. (it's labeled if you forget the arrangement)
- The left half of the data is from the 129 strain, the right from black 6.
- Each pair of columns corresponds to a pair of replicates
- The tissues are organized in the order: Amygdala, Cerebellum, Cortex, Entorhinal Cortex, Hippocampus, and Midbrain.
- In the block images, the first column has a tick if the gene was on Sandberg's list.
- In the second column in the block images, the mean expression level of the gene is represented. An expression value of zero is represented by white, and values equal to or over 1000 are dark blue. This is shown because the data for the images have been adjusted to a row mean of zero variance of one.

In mosts cases the block images are clickable: click on a gene to get details about the analysis. Good aim is required - my apologies for the clunkiness of the interface but it's better than nothing.