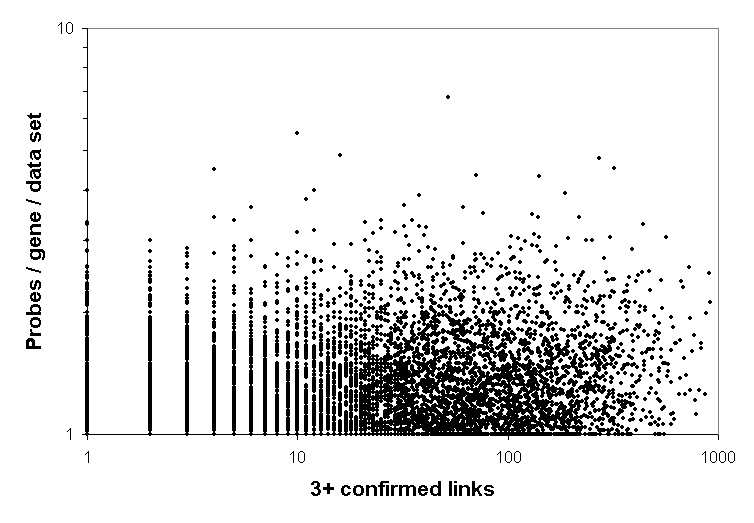
This figure shows the relationship between the number of links for a gene and the number of probes per data set for the gene. Note that both axes are logarithmic. A value of 2 on the y axis means that the gene has 2 probes per data set on average. Though not obvious from this figure, there is a low positive correlation between the number of links and the number of probes per gene per data set.