Pattern or template definition
Patterns, or templates, are simple files that define an expression pattern of interest. This page explains how to define templates and set up the files. Templates are used as inputs to patternmatch.
A template file is just a one-line list of numbers, and might look like this:
0 0 0 1 1 1 0 0 0 .5 .5 .5
where each number represents one column in the data file.
Important points to remember
- The terms template and pattern are used interchangably.
- The template file must be a plain text file. You can create one in Excel or Word, or any other program with the option to "Save as text". For instruction on how to do this in excel, follow this link.
- The template must be on the first line of the file.
- There must be a number in the template file for each and every data column. Missing columns will yield undefined results.
- The numbers in a template refer to arbitrary expression values.
- If you use the 'absolute value' option in patternmatch, genes matching either the pattern or its "opposite" will be given equal scores.
- If you change the order of columns in your data file, you must also change the templates you are using to analyze it.
- Only the shape of the template is important when using the correlation coefficient (as patternmatch does). The correlation of the gene expression pattern with the template is a measure of "how much the gene looks like the template" (loosely speaking).
- A t-test between two groups in your data will give equivalent results to a template having only two expression levels.
A simple example
We start with a data file that looks something like this:
| gene | mutant | mutant | mutant | wildtype | wildtype | wildtype |
|---|---|---|---|---|---|---|
| 100001_at | -36.3 | 77.8 | 64.4 | 89.4 | 126.6 | 86.2 |
| 100002_at | 1504.2 | 1512 | 944.5 | 1157.9 | 1652 | 1358.9 |
| 100003_at | 845.9 | 966.5 | 1057.4 | 987.4 | 764.1 | 878.5 |
(etc, for many lines)
We wish to define 'idealized' expression patterns that we are interested in. In this simple example, we are probably interested in genes which are different between mutant and wild type animals. Let's assume that genes which are overexpressed in the mutant are as interesting as ones which are underexpressed. So we can define one template that corresponds to either expression pattern.
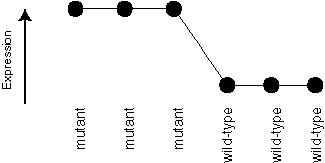
If we plotted the expression values, an ideal kind of gene we are looking for would have an expression profile like this:

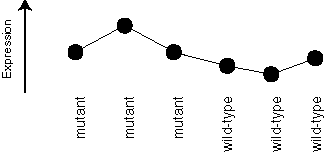
A less ideal example might be like this one:

We want our method to give the first gene a higher score than the second one.
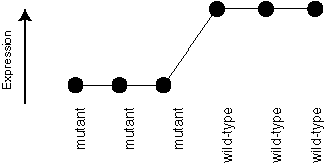
We're equally interested in genes like this, which has the "opposite" expression pattern:

The template or pattern we use to define this situation is:
0 0 0 1 1 1
0 and 1 stand for two different arbitrary expression levels. You can read this template as "A gene which is expressed at one level in the first three samples, and at another level in the next three samples." Another way to put this is to think of the "expression" arrow at the left of the pictures above pointing in the opposite direction. The correlation coeffient will give equally high absolute scores to each situation.
If we wanted to select ONLY genes like the first one, and do the third type (the "opposite" pattern) separately, be sure to NOT use the absolute value of the correlation coefficient. You would then run a separate template to identify genes like the third one shown above:
1 1 1 0 0 0
Otherwise, patternmatch considers these two template to be equivalent.
A final note: this case is so simple, that the template matching problem reduces to a t-test between the two groups. In fact, any time you have only two expression levels in your template, you can do a t-test to get equivalent results. The only advantage of the template matching method is that it is helpful to conceptualize the problem as one of finding expression patterns. In more complex cases, the t-test does not apply. That's what the next example shows.
A more complex example
In this example, we have multiple experimental groups. We decide (for some reason) that we want genes that show three levels of expression. Here is what our data file looks like.
| gene | sample1 | sample2 | sample3 | sample4 | sample5 | sample6 | sample7 | sample8 | sample9 | sample10 | sample11 | sample12 |
|---|---|---|---|---|---|---|---|---|---|---|---|---|
| gene1 | 94.2 | 227.7 | 308.3 | 48.8 | 170.1 | 154.3 | 160.4 | 106.2 | 40.7 | 22.5 | 184.4 | 98.9 |
| gene2 | 73.4 | 172.5 | 242.1 | -8.8 | 148.8 | 190.3 | 155.1 | 205.3 | 337.8 | 276 | -64.2 | 295.4 |
| gene3 | 30893.6 | 30933.3 | 28685.9 | 33768.5 | 27873.8 | 28285.6 | 30592.3 | 33936.9 | 31307.9 | 27969 | 31922.8 | 28736.9 |
| gene4 | 2106.8 | 514.1 | 1918.7 | 213.6 | 783.3 | 878.4 | 1060.4 | 678.1 | 659.9 | 1133.7 | 2090.8 | 469.6 |
| gene5 | 38821.6 | 38903.1 | 39683 | 43102.3 | 39869.7 | 36460.7 | 37030.1 | 40379.5 | 37286.5 | 37800.6 | 38389.9 | 37619.6 |
| gene6 | 103.4 | -100.5 | 306.5 | 204.2 | 391.6 | 141 | 270.1 | 125.5 | 195 | 477.9 | 153.2 | 124.3 |
And here is the expression pattern we are after (defined by the experimenter):

And here is the template we might use:
0 0 0 1 1 1 0 0 0 -1 -1 -1
We could have equivalently used the following template, with identical results:
1 1 1 2 2 2 1 1 1 0 0 0
Note that this may not be the best way to start to look for complex but 'nonspecific' patterns like this. If you are really interested in a very specific pattern like this one (including the relative levels of expression it implies), then it should work well. A better method might be to use ANOVA and then maybe apply the templates, or even clustering.
References
- For more details on correlation measures, look at any statistics text book.